Where Does My Money Go? 7 Leaks Draining Your Paycheck
"Where does my money go?" is the most honest question in personal finance, and almost nobody can answer it from memory.
This post names the 7 leaks that quietly drain a normal paycheck, with a shocking statistic behind each one and a concrete fix you can do this week.
To make it real, we built a demo account in Pikaflow for a persona we'll call Maya: $4,300 a month in take-home pay, rent of $1,450, a gym, a few streaming services, and six months of ordinary spending logged the way a real person would log it. Every screenshot below is her data.
The headline finding is uncomfortable. Five of the seven leaks cost Maya about $750 a month, or roughly $9,000 a year, and not one of them felt like a big purchase at the time.
You'll see exactly how each leak showed up in her tracker, starting with the one that hides best: the subscriptions you forgot you were paying for.
Let's open the books.
Leak 1: The subscriptions you forgot you have
Most people underestimate their subscription spending by more than half.
When C+R Research asked 1,000 consumers to guess their monthly subscription total, the average guess was $86. When the same people itemized every charge, the real number was $219. That's 2.5x the guess.
It gets worse. In the same survey, 42% admitted they had stopped using a service but forgot they were still paying, and 72% had every subscription on autopay. Autopay is the whole trick: the charge never asks for permission twice.
The habit hasn't faded. A March 2026 survey of 1,272 U.S. adults by Self Financial found 59.9% had at least one paid subscription they hadn't used in 30 days, averaging 2.6 unused subscriptions and $26.79 a month.
Here's what that looks like in Maya's account. She has 9 subscriptions totalling $134.92 a month against a $60 budget. Five of them (Disney+, a Peloton app, Adobe Lightroom, Duolingo Super and Dropbox Plus) haven't been opened since spring.
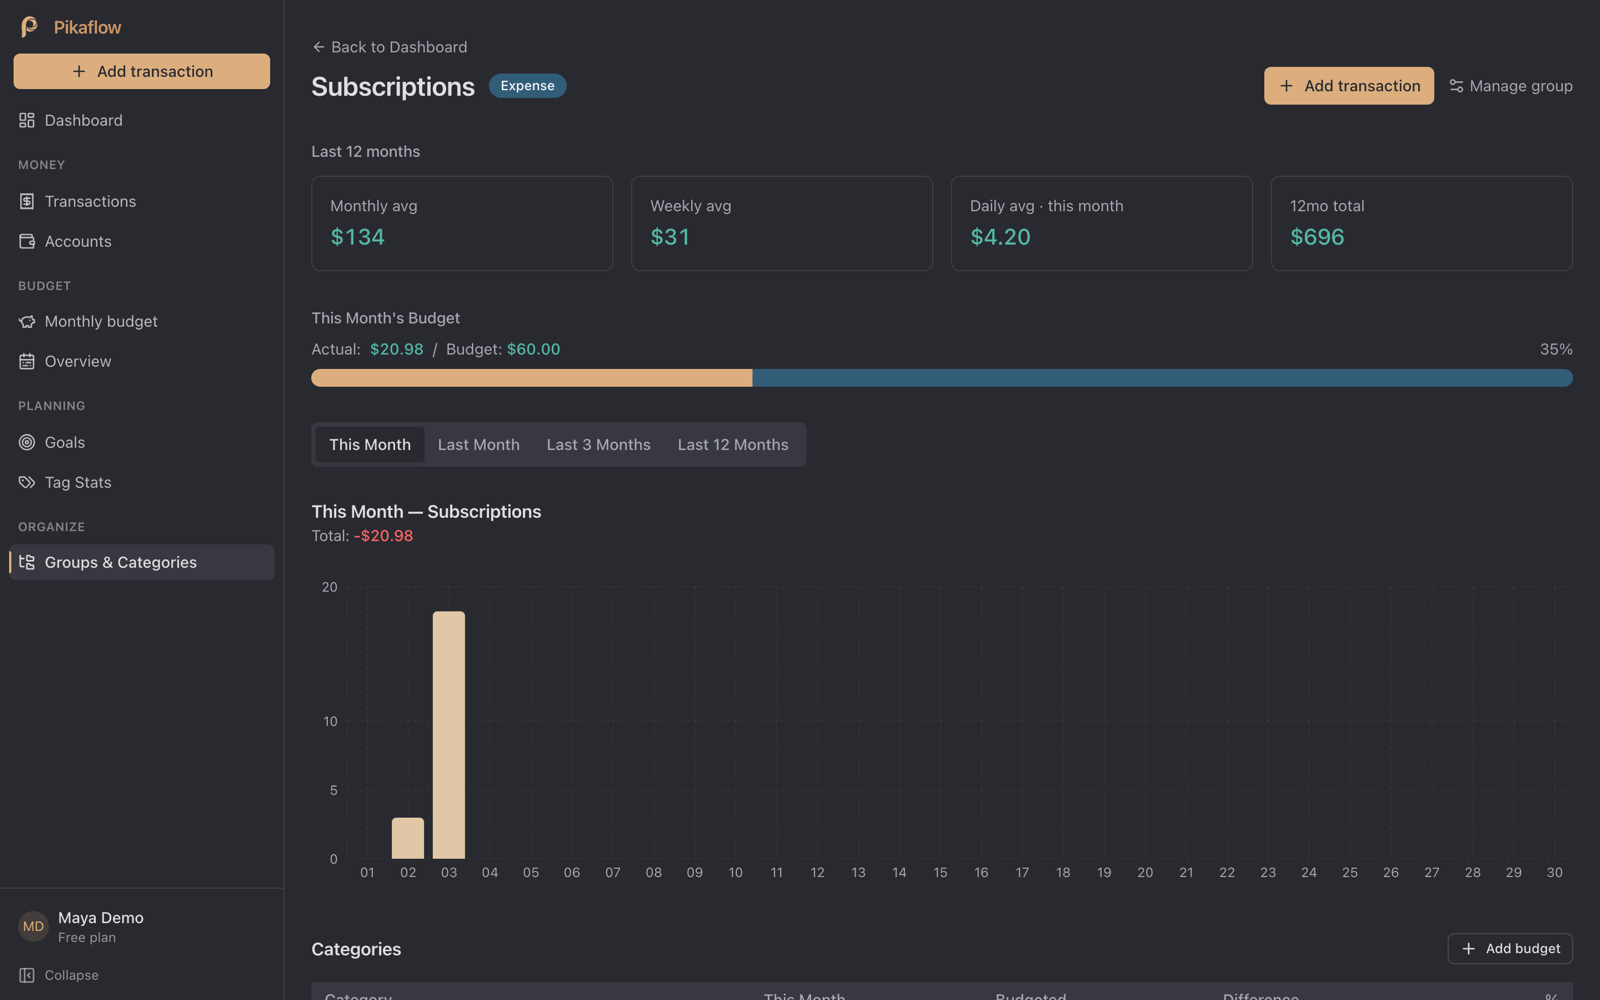
Those five forgotten subscriptions cost her $76.95 a month. That's $923 a year for things she doesn't use.
How to plug it:
- Pull one full month of card and bank statements and highlight every recurring charge. Don't trust memory; the C+R data says memory is off by $133.
- Log each one in your tracker under a Subscriptions group, then tag the ones you haven't opened in 30 days. Maya's tag is simply "Forgotten sub".
- Cancel the tagged ones today. Not "review later". Today.
- Set a monthly budget for the group so the total has a ceiling and a colour.
Pro tip: Put subscriptions on one card. One statement, one place to look, and the "staggered billing dates across three cards" problem disappears.
Leak 2: Delivery apps that mark your dinner up 59% to 75%
The food isn't the expense. The convenience is.
CouponFollow priced the same orders from nine restaurants in three cities and found Uber Eats marks menu prices up by an average of 75%, Grubhub by 66% and DoorDash by 59%, before tips. Nearly a third of their 1,136 respondents had takeout delivered more than once a week.
So a $22 burrito bowl at the counter becomes a $35 to $38 burrito bowl on the couch.
Maya's tracker shows it. Over five full months she placed 34 delivery orders at an average of $37.54 each. That's $255 a month, or about $3,060 a year. At the markups above, the same food picked up at the counter would have cost her roughly $150 a month.
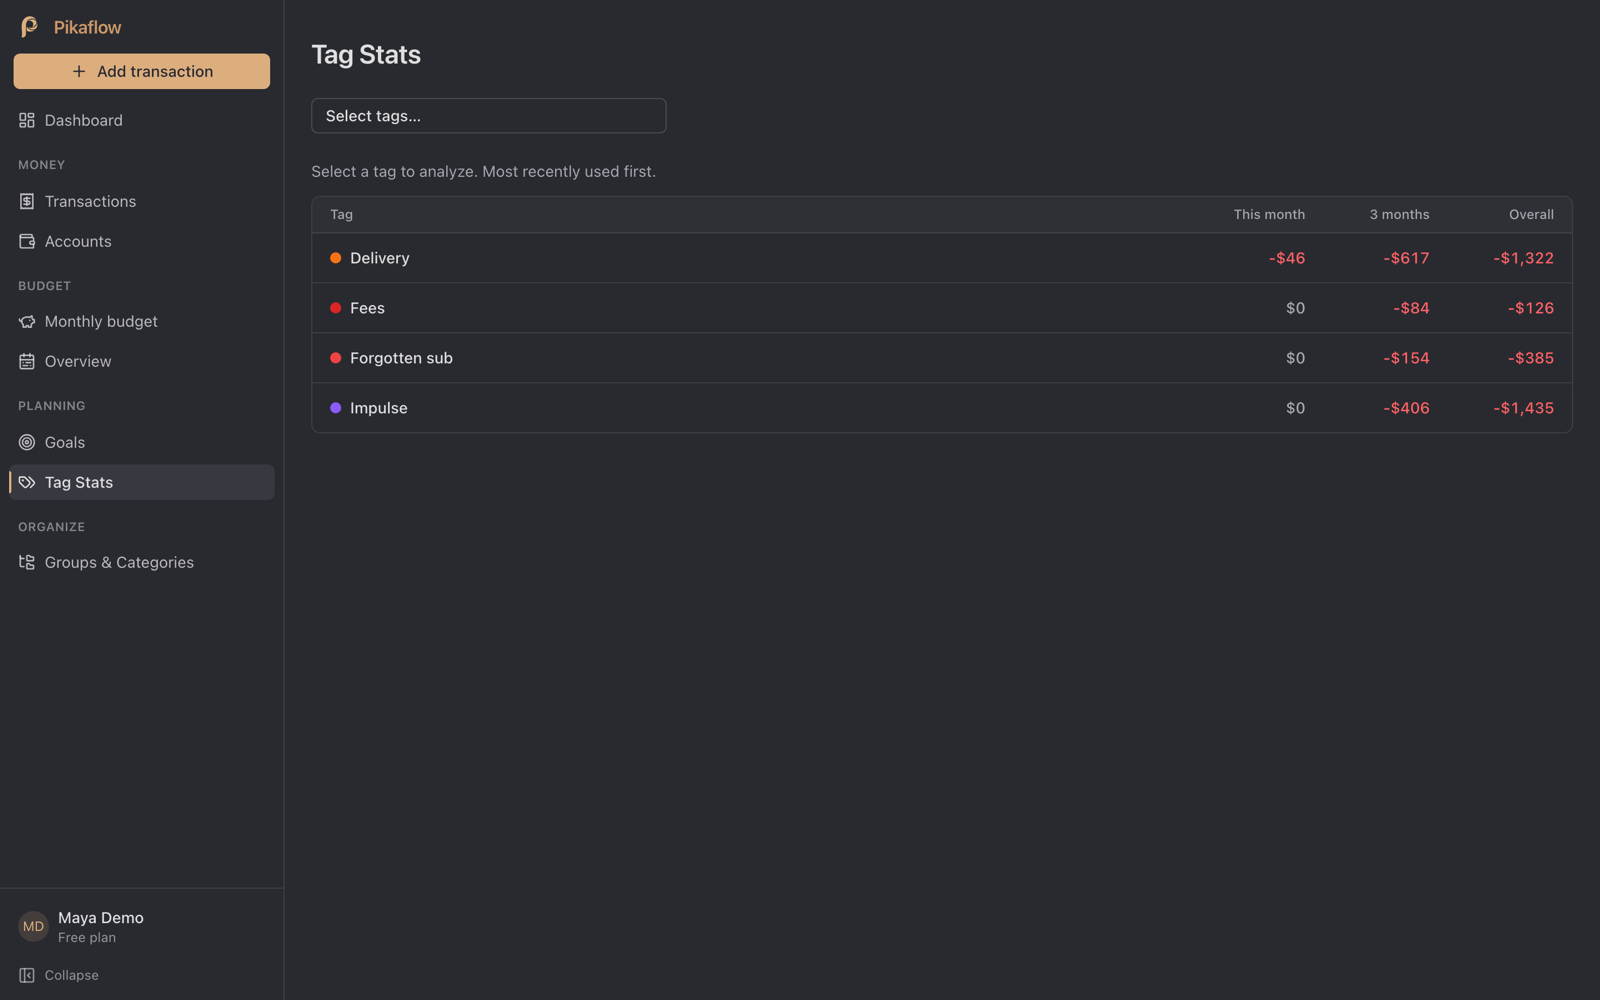
Notice the Delivery tag total: $1,322 and counting. She didn't feel any single order. She felt the total when she finally saw it on one line.
How to plug it:
- Tag every delivery order "Delivery" for one month. Don't change anything yet, just tag.
- At month end, open your tag totals and read the number out loud.
- Pick a cap that hurts a little (Maya's is two orders a week) and put the difference into the emergency fund from Leak 7.
- Keep tagging. The number only stays down while you can see it.
Leak 3: Restaurants overtaking the grocery store
The average U.S. household now spends $3,945 a year eating out.
That's from the Bureau of Labor Statistics' Consumer Expenditures in 2024 report. Total food spending was $10,169 per household, with $6,224 at home and $3,945 away from home. Almost 4 in 10 food dollars never see your kitchen.
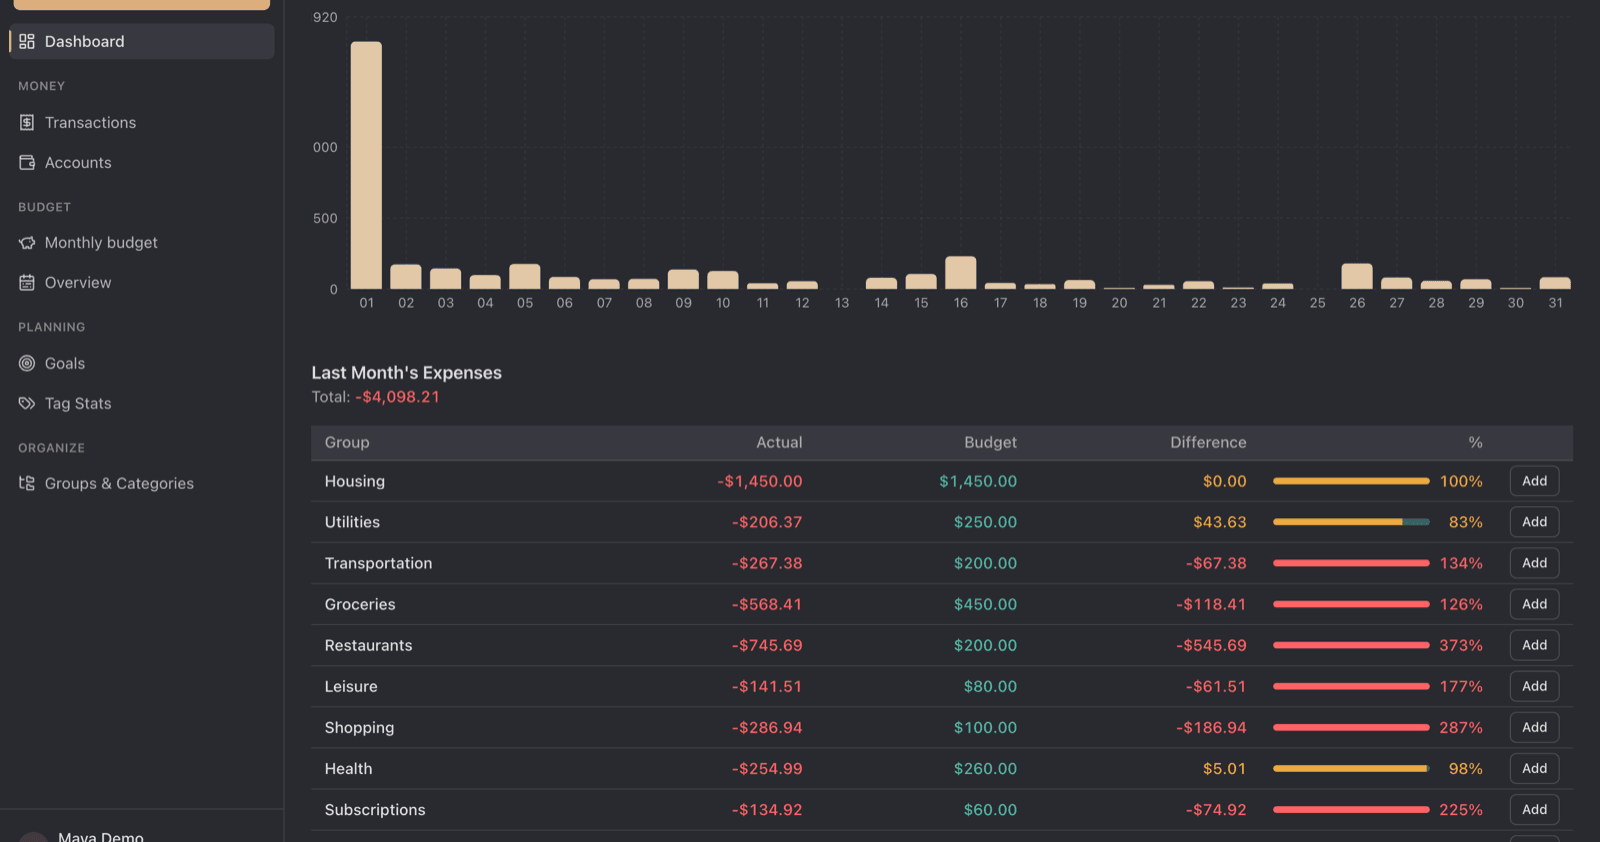
Maya is well past average. Her Restaurants group (delivery, coffee, dining out and fast food together) averaged $611 a month, against $473 a month on groceries. She eats out more than she eats in.
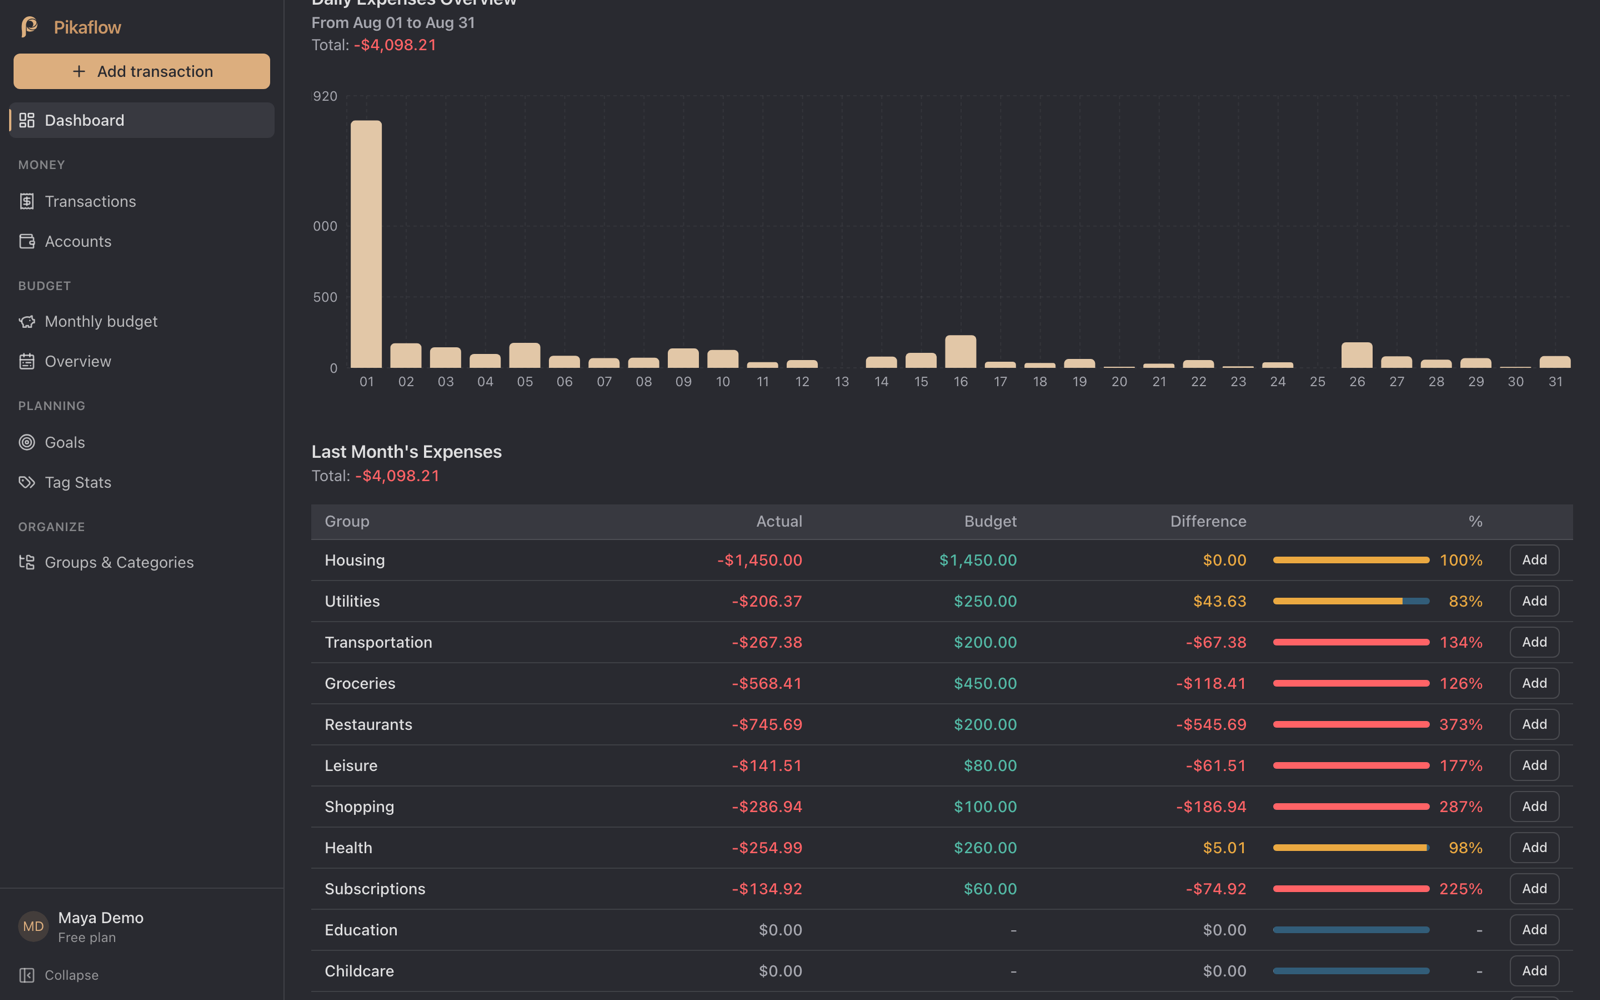
August was the peak: $745.69 against a $200 budget. That's 373% of plan, and the single biggest overage in her month.
The coffee line alone is worth a look: 83 coffees in five months at an average of $6.35. That's $105 a month, about $1,270 a year, for something she also owns a machine for.
How to plug it:
- Split "food" into two groups: Groceries and Restaurants. One number hides the ratio; two numbers expose it.
- Give Restaurants a budget that's smaller than Groceries. If the bar goes red before the 20th, you've learned something.
- Log the coffee. Ten seconds at the counter. The point isn't guilt; it's that a $6 habit is invisible until it's 17 times a month.
Pro tip: Track restaurant spending by category (Coffee, Takeout, Dining Out, Fast Food). Maya's problem wasn't dinners with friends; it was delivery and coffee, which are the two easiest to cut.
Leak 4: Impulse buys of $26 that add up to $3,000
The average consumer spent $254 a month on impulse purchases in 2025.
Capital One Shopping puts it at 9.94 unplanned purchases a month at $25.93 each, for $3,045 a year. 92% of shoppers have some history of impulse buying, 36% say most of their purchases are unplanned, and 54% have dropped $100 or more on a single whim.
The key word is "unplanned". Nothing here is a big-ticket item. It's the phone charger, the sale hoodie, the "while I'm on Amazon anyway".
Maya tagged 30 purchases "Impulse" in five months: $1,434.66, or $287 a month. Her biggest were an AirPods case at $129.37 and two Nike sale orders at $118.71 and $114.71. The sale saved her money on things she wasn't going to buy.
How to plug it:
- Create an "Impulse" tag and apply it honestly. The test: did you know you'd buy this when you woke up?
- Set a Shopping budget you'd be comfortable saying out loud. Maya's is $100 a month; she ran 287% of it in August.
- Add a 48-hour rule for anything over $50. Log it as a note in your tracker first; buy it in two days if you still want it.
- Once a month, sort your Impulse tag by amount and look at the top three. That's where the money went.
Leak 5: Fees you pay for not knowing your balance
Americans paid an estimated $12.4 billion in overdraft and non-sufficient-funds fees in 2025.
That's the National Consumer Law Center's estimate, up from $12.1 billion in 2024. About a quarter of people live in households that pay these fees each year, and the CFPB's now-reversed rule would have saved those families about $225 a year each.
Buy-now-pay-later has its own fee trap. Bankrate's March 2025 survey of 2,354 U.S. adults found 30% had used a BNPL service, and 49% of users hit at least one problem: 24% overspent, 16% missed a payment, and 15% regretted a purchase. 57% used it to stretch their cash flow, which is a polite way of saying they didn't know what was in the account.
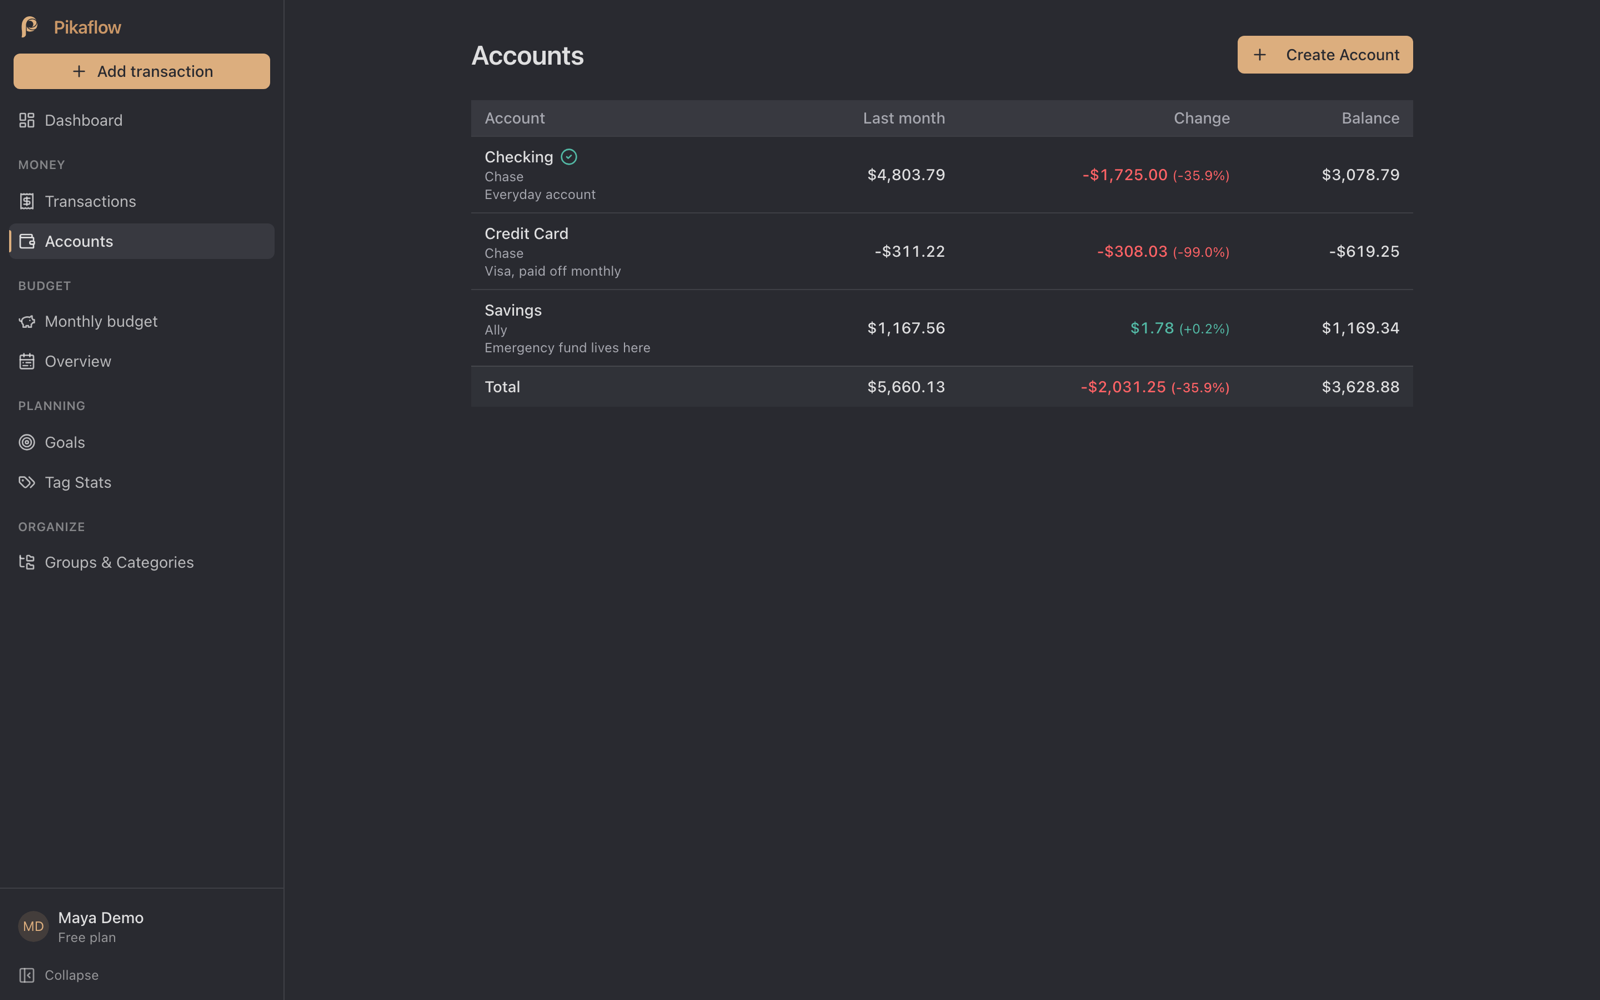
Maya paid $126 in fees over five months: three $35 overdrafts and three $7 late fees. Small, quiet, and 100% caused by not knowing her balance on the day a bill landed.
How to plug it:
- Keep every account in one view, with balances you update yourself. If you log the rent on the 1st, you know what's left on the 2nd.
- Move fixed bills to land after payday, not before. Maya's rent, insurance and gym all hit on the 1st; her paycheck lands on the 15th and 31st. That gap is where overdrafts are born.
- Tag every fee "Fees". A $35 charge feels like bad luck once; the tag total makes it a pattern.
- Treat a BNPL plan as a loan and log every instalment on its due date the day you sign up.
Leak 6: The budget you made and never checked
Just over half of U.S. adults say they have a budget. Most check it in a spreadsheet.
YouGov's February 2026 survey of 1,340 adults found 53% have a budget for 2026, up from 46% in 2025. Spreadsheets are the most common tool at 35%, budgeting apps sit at 16%, and bank-provided tools at 17%. Among those who budget, WalletHub's 2025 survey found 83% name rising costs as their biggest challenge.
A budget you don't compare against actual spending is a wish list. The comparison is the whole product.
Here is Maya's August, budget next to reality. She planned $3,050 in expenses and a $1,250 surplus. She spent $4,098. Six of nine budgeted groups went red.
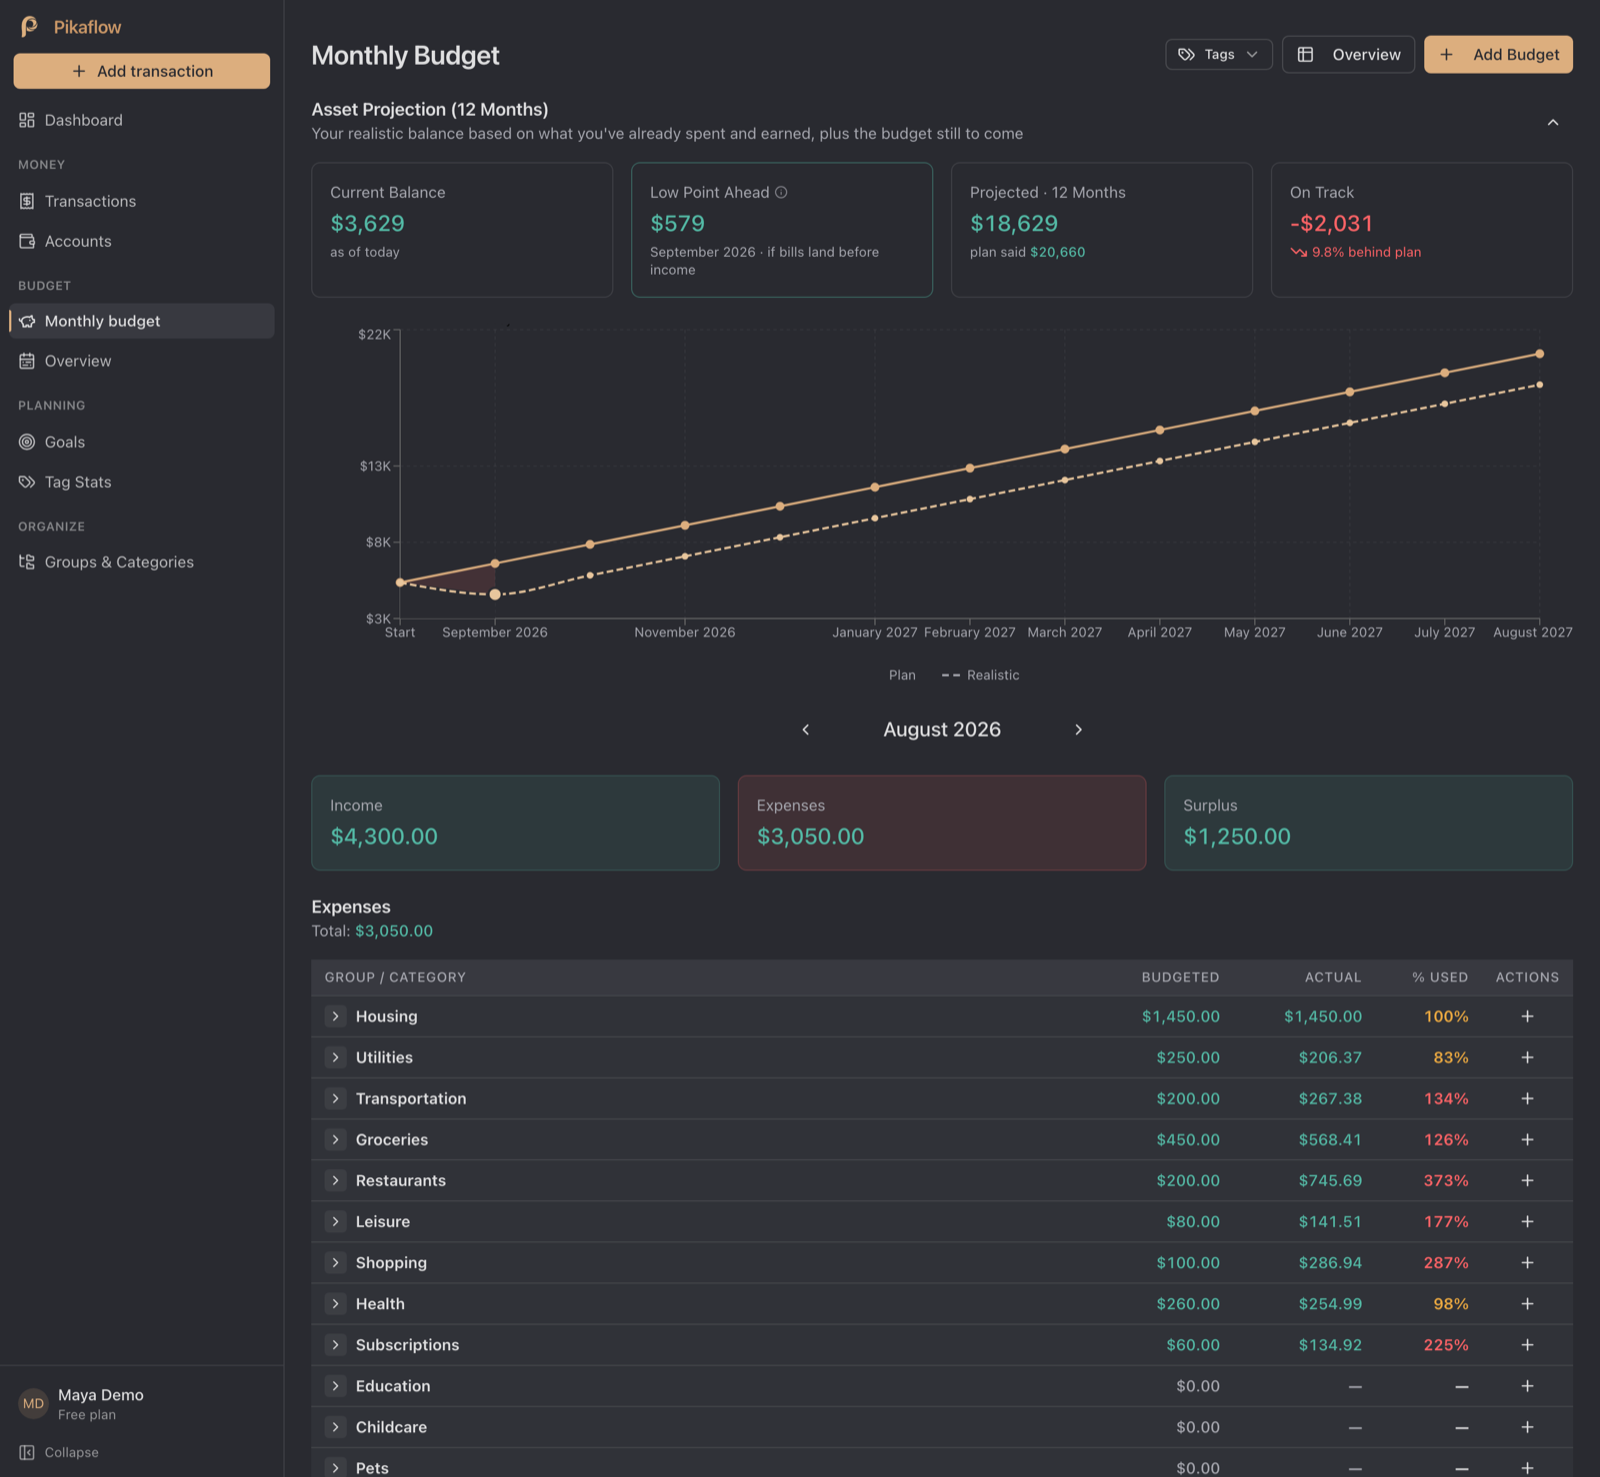
The projection at the top is the part that changes behaviour. The solid line is the plan: $20,660 in twelve months. The dashed line is reality at the current pace: $18,629. The gap is $2,031, and it's drawn, not implied.
How to plug it:
- Budget by group, not by 60 categories. Ten lines you'll actually read beat sixty you'll ignore.
- Compare budget to actual weekly, not monthly. Red on the 12th is fixable. Red on the 31st is a story.
- Look at the 12-month projection once a month. If the dashed line is below the solid one, pick the group with the biggest overage and cut there first.
Pro tip: Make your budget slightly too tight on purpose. Maya's $200 Restaurants line is unrealistic, and that's useful: the moment it goes red, she knows which habit to look at.
Leak 7: No cushion, so every surprise becomes debt
Only 47% of Americans could cover a $1,000 emergency from savings.
Bankrate's December 2025 survey of 2,564 adults found 24% have no emergency savings at all, 29% have more credit card debt than emergency savings, and only 46% could cover three months of expenses. A cracked windshield is a Tuesday for the first group and a 24% APR balance for the rest.
This is the leak that turns the other six into interest. Without a buffer, the $35 overdraft, the missed BNPL payment and the "I'll pay it off next month" card balance all feed each other.
Maya's fix is deliberately boring: a $150 transfer to savings on the 16th of every month, the day after payday, tracked as a goal.
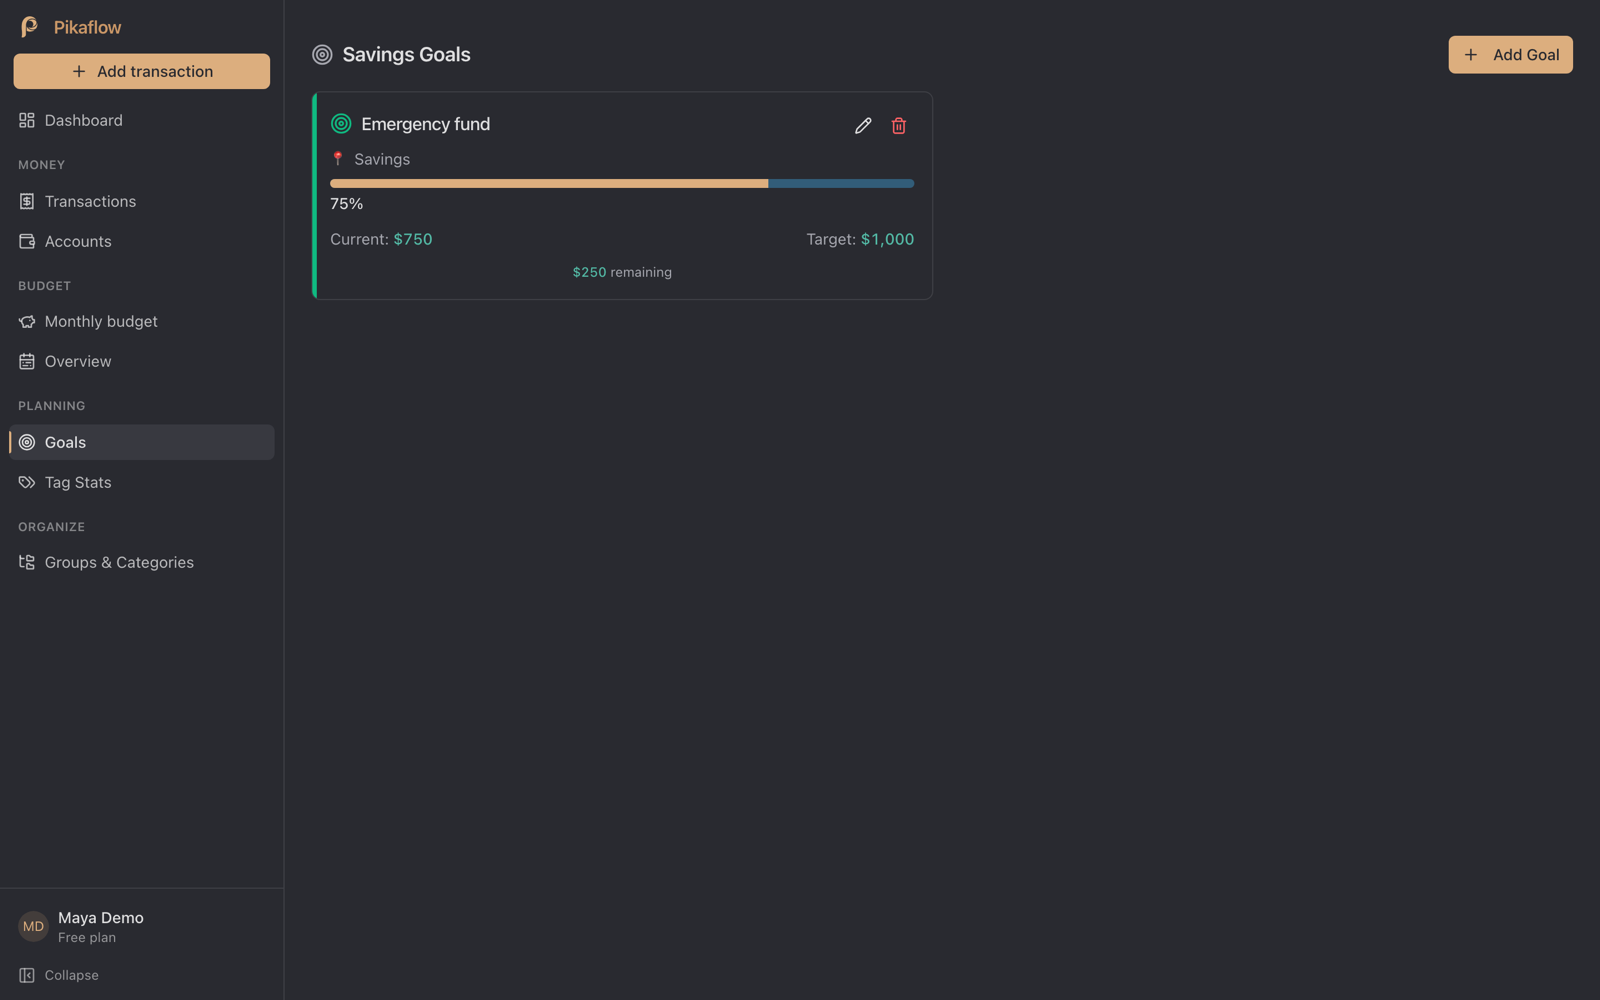
She's at $750 of $1,000. Two more transfers and she's out of the 53% who can't cover a surprise.
How to plug it:
- Pick a first target of $1,000, not "three months of expenses". The first one is reachable in a season; the second one is a reason to quit.
- Automate one transfer for the day after payday and log it as a goal contribution so you can watch the bar move.
- Fund it from the leaks above. Maya's forgotten subscriptions alone ($77 a month) cover half the transfer.
What the seven leaks cost Maya
Here's the whole picture on one table, from five full months of tracked data.
| Leak | Maya's monthly cost | Per year | The fix |
|---|---|---|---|
| Forgotten subscriptions | $77 | $923 | Tag, cancel, budget the group |
| Delivery apps | $255 | $3,063 | Tag it, cap it at 2 a week |
| Coffee (inside Restaurants) | $105 | $1,266 | Log it, budget by category |
| Impulse buys | $287 | $3,443 | Impulse tag, 48-hour rule |
| Bank and BNPL fees | $25 | $302 | Know the balance, move bill dates |
| Total | about $750 | about $9,000 |
Leaks 6 and 7 don't have a dollar line because they're the reason the other five persist: no comparison against a plan, and no cushion when they bite.
$9,000 a year is 17% of Maya's take-home pay. She didn't earn too little. She just couldn't see where it went.
Start with the leak you can find in ten minutes
You don't need to fix all seven this month. You need to find one.
The fastest win is Leak 1. Open your last statement, list every recurring charge, and cancel anything you haven't used in 30 days. The C+R data says the average gap between what people guess and what they actually pay is $133 a month, so expect the list to be longer than you think.
Then start logging. Not everything, not perfectly. Just today's purchases, at the counter, in ten seconds each.
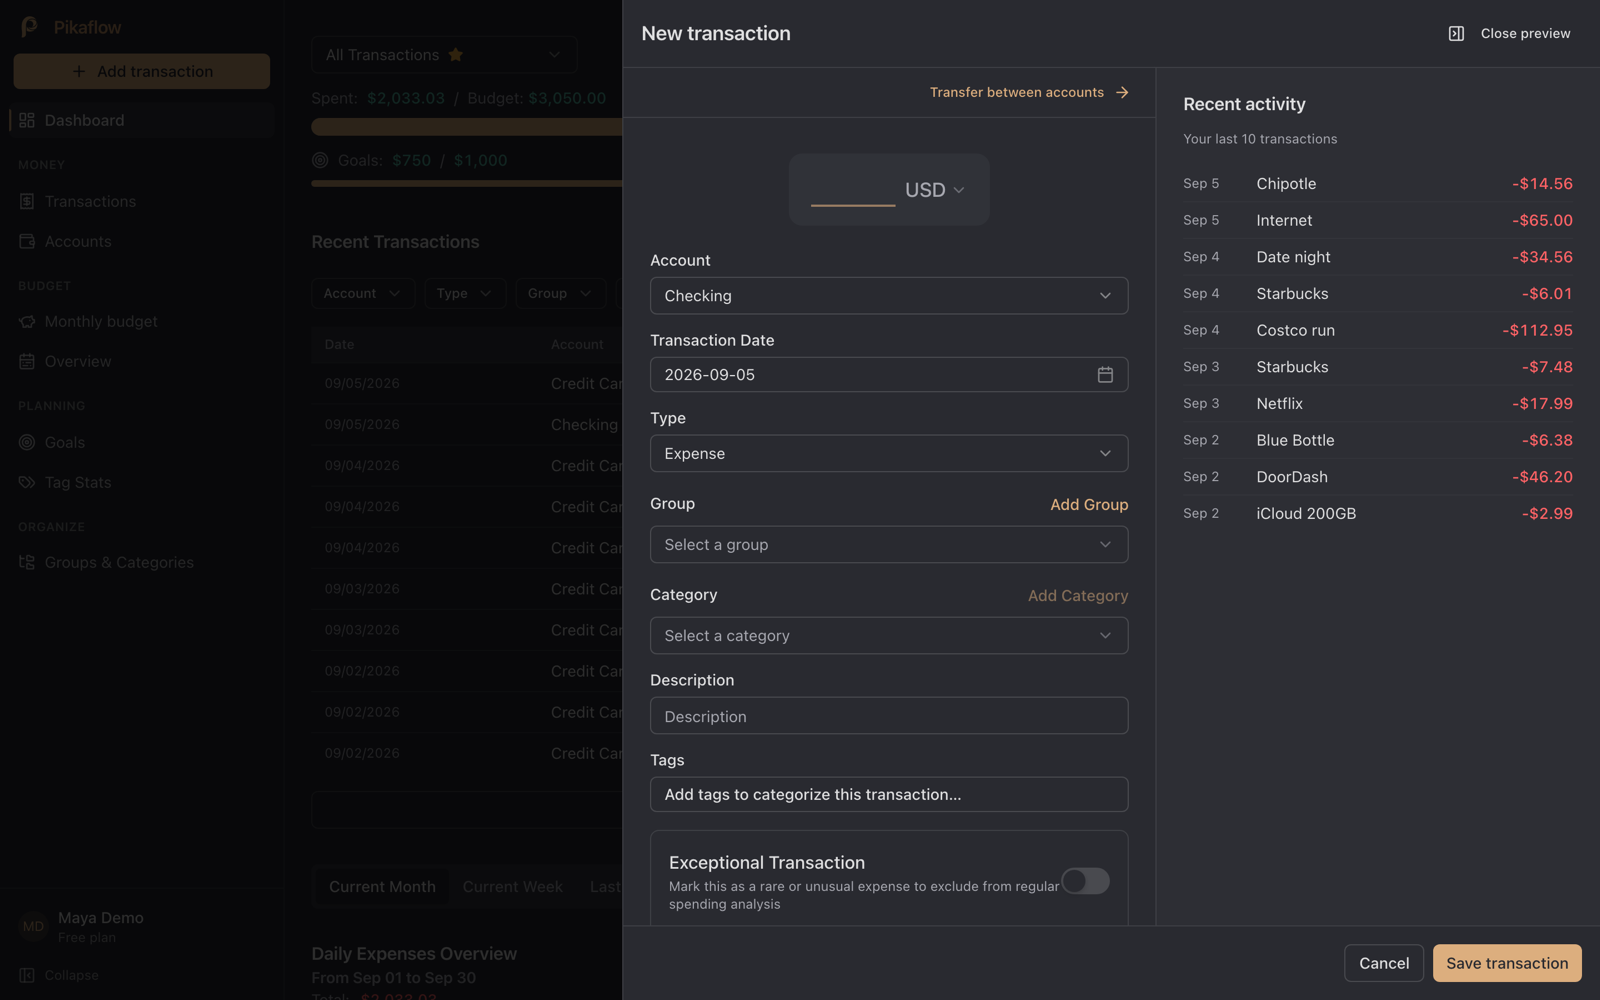
That's how Maya's data exists, and it's how the $750 stopped being invisible.
Pikaflow is built around exactly that habit: log it when it happens, see the month by group and tag, compare it to a plan you can actually read. No bank logins, no spreadsheets, no imports. Every account starts with a free month and no card required.
Start tracking free and find your first leak this week. Or take the longer tour on the features page and see the pricing first.
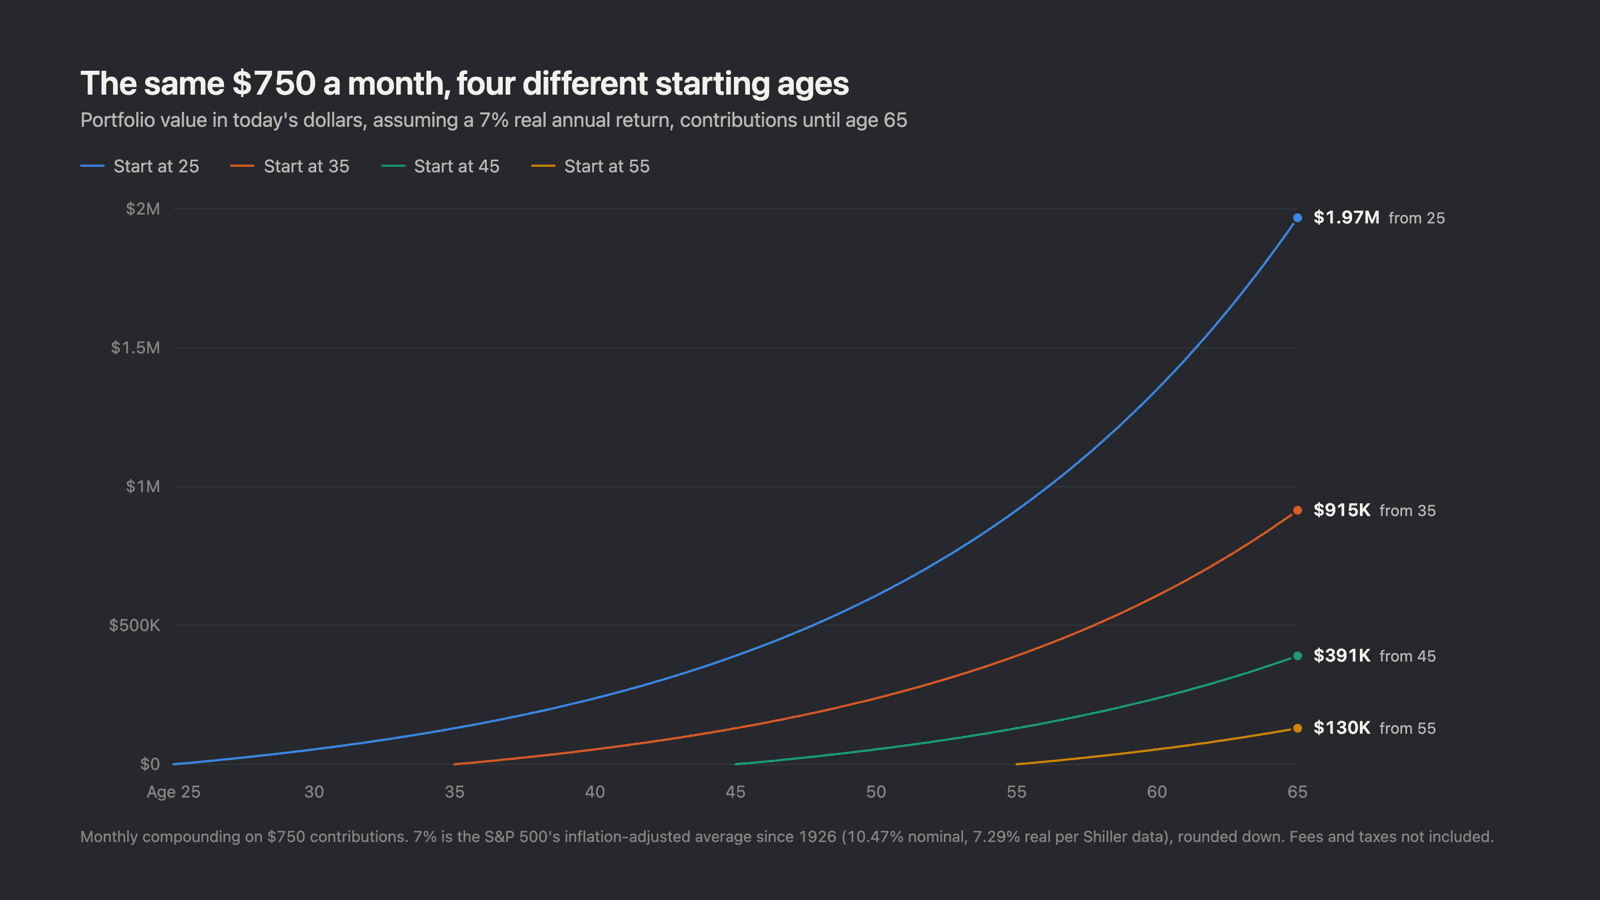
And once the $750 exists, see what it turns into: Compound Interest by Age: Why Ten Years Beats Thirty.
Sources
- C+R Research, "Subscription Service Statistics and Costs" (survey of 1,000 U.S. consumers, April 22 to May 2, 2022): https://www.crresearch.com/blog/subscription-service-statistics-and-costs/
- Self Financial, "Cost of Unused Paid Subscriptions" (survey of 1,272 U.S. adults, March 2026): https://www.self.inc/info/cost-of-unused-paid-subscriptions/
- The Desk, reporting on the CNET/YouGov subscription survey (2,440 Americans, May 2025): https://thedesk.net/2025/05/cnet-subscription-survey-2025/
- CouponFollow, "The Cost of On-Demand Food Delivery" (1,136 respondents; nine restaurants in three cities): https://couponfollow.com/research/cost-of-on-demand-food-delivery
- U.S. Bureau of Labor Statistics, "Consumer Expenditures in 2024": https://www.bls.gov/opub/reports/consumer-expenditures/2024/home.htm
- Capital One Shopping Research, "Impulse Buying Statistics" (2025 figures): https://capitaloneshopping.com/research/impulse-buying-statistics/
- National Consumer Law Center, "Overdraft Fees Rising in Absence of CFPB Rule" (2025 estimate): https://www.nclc.org/resources/overdraft-fees-rising-in-absence-of-cfpb-rule/
- Bankrate, "Buy Now, Pay Later Survey" (2,354 U.S. adults, March 19 to 21, 2025): https://www.bankrate.com/loans/personal-loans/buy-now-pay-later-survey/
- YouGov, "U.S. consumer spending and budgeting trends in 2026" (1,340 adults, February 12 to 18, 2026): https://yougov.com/en-us/articles/54197-us-consumer-spending-and-budgeting-trends-in-2026
- WalletHub, "Budgeting Statistics" (2025 survey): https://wallethub.com/edu/budgeting-statistics/146387
- Bankrate, "Emergency Savings Report" (2,564 U.S. adults, December 2 to 8, 2025): https://www.bankrate.com/banking/savings/emergency-savings-report/
Maya is a demo persona. Her numbers come from a seeded Pikaflow account built to look like an ordinary month, not from a real customer.